There are two ways through which you can debug X++ code in Microsoft Visual Studio.
- Debug X++ code by setting as Startup object
- Debug X++ code by attaching it with the process
In part-1 I will be discussing about the first technique in which debugging will be performed by setting as Startup object.
To debug X++ code with startup object technique , following are the steps.
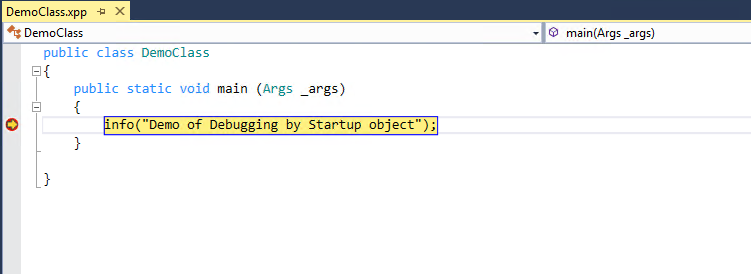
Step1 ) Open the X++ code in Visual Studio to debug
Step 2) Find the line or lines where you want to debug and set a breakpoints on those lines. In order to set a break point go to the line and press F9 or left click and go to breakpoint and select insert a break point. You will see a red dot which indicates that break point has been added.


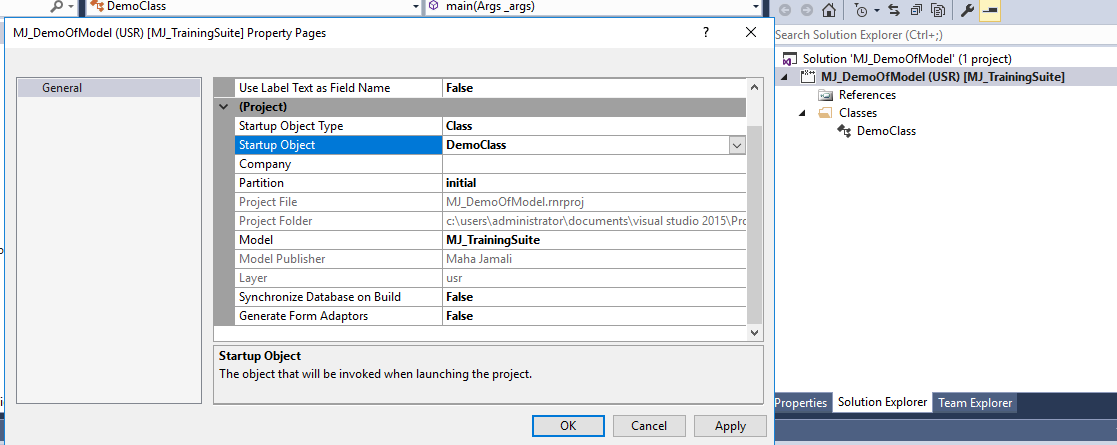
Step 3) Now right click on project and go to its properties and set your class as Startup object.
Step 4) On debug menu , select start debugging

Step 5) Wait, till symbols are loaded and your debugging will be started.
Note: If your breakpoint does not hit then you might need to rebuild model and restart visual studio.


Your blog is interesting to read, thanks for sharing this and keep update your blog regularly.
ReplyDeletemicrosoft dynamics crm training in chennai
microsoft dynamics crm training courses
crm training in chennai
Tally Training in Chennai
Web Designing course in Chennai
ui ux design course in Chennai
microsoft dynamics crm training in Porur
microsoft dynamics crm training in Tambaram
microsoft dynamics crm training in Adyar
Thanks.
Delete